Multiclass Classification using Neural Networks
Leveraging Neural Networks to Predict La-Liga Match Outcomes: MultiClass Classification
Hello Legends, Today we are going to discuss - How to leverage neural networks for Multiclass Classification.
This article is long. Visit this link for the best viewing experience.
If you’re not a subscriber, you may have missed:
Unleashing the Power of Dask: Conquer Data at Lightning Speed!
From Underdog to Top Contender: How I Surpassed 76% of Teams on Kaggle with Machine Learning Methods
Python Development Best Practices: Virtual Environments and requirements.txt
Welcome to the fourth edition of Hustle Data, my weekly newsletter. I would like to apologize for not sending out any newsletter issue the previous week. Through this journey, I've discovered that delivering a newsletter consistently is not easy as it looks like, and on top of that constraining myself to strict deadlines hampers the quality of the content I wish to deliver. Therefore, I've made a decision: I will continue delivering this newsletter once a week, without forcing myself to deliver it on a specific day. This way, I can ensure the content maintains its highest standard while staying true to the essence of Hustle Data.
INTRODUCTION
La Liga usually referred to as the Primera División, is the top level of the Spanish football professional league. It is one of the best pro leagues in Europe and has given birth to some of the world’s most successful clubs. In this project, we’ll use information gathered from previous La Liga matches to analyze and predict the results of upcoming games using neural networks that have been implemented in PyTorch. We will examine the data carefully to find patterns and trends that can be used to develop our model and produce reliable predictions.
The La-Liga match dataset contains data from 2015–2021 which we will be using to train our model and for the testing, of the model built we will use the data from 2022–2023. This data was collected from FBREF. You can find the repository containing all the code here.
FEATURES
The Features available in our Match Dataset are:
Date — Date of when the match was played
Team — Name of La Liga Team
Venue — Whether it was a Home match or Away match
Result — Result of Match played
GF — Goals Scored by a Team
GA — Goals conceded by a Team
Opponent — Name of La Liga which they played against
xG — Expected Goals of a Team
xGA — Expected Assists of a Team
Poss — Possession gained by a Team
Formation — The playing formation of a team in a match
ShotCreatingAction — Total Shot Creating Action in a match
PassLive(Leading to Shot Attempt) — Number of live Passes that lead to Shot attempt
PassDead(Leading to Shot Attempt) — Number of dead Passes that lead to Shot attempt
DribblesLeadingtoShot — Dribbles that lead to a Shot in a match by Team
goalCreatingAction — Passage of play which leads to Goal Creation by Team
PassLive(Leading to Goals) — Number of live Passes that lead to goals
PassDead(Leading to Goals) — Number of dead Passes that lead to goals
Dribbles(Leading to Goals) — Dribbles that lead to goals in a match by Team
Total_Shots — Number of shots taken by a Team
Shots_on_Target — Shots on Target by a Team
Shots_on_Target% — Shots on Target % by a Team
Goals/Shot — Goals scored for every shot by a team
Goal/shot_on_target — Goals scored per shots on target by a team
Distance_from_goals_scored — Distance from Goal was scored by a team
Freekick — Freekick awarded to a team.
Penalty_kick — Penalty awarded to a team
CODE IMPLEMENTATION
We first need to import the required libraries before we can start studying the La Liga match dataset.
Let’s read our Training Data and Test Data
In the data preprocessing stage, handling missing values in a dataset is a crucial step. There are many ways to deal with missing values, including eliminating the rows or columns with missing values, imputing the missing values with a certain value, or using the column’s mean or median. In our dataset, we will be filling out the missing values using the mean of the column.
MISSING VALUES
Check for missing values in Train Dataset
Check for missing values in Test Dataset
Let’s impute these missing values with the mean of each column in both the training and test dataset.
The goal is to make predictions about upcoming games using a subset of features from the La Liga match dataset. We will carefully choose the features, such as team statistics, player performance, and match-specific data, that are crucial to the prediction objective. We hope to create a model that is more accurate and less prone to overfitting. In order to get the best outcomes, it may be necessary to conduct further research and experimentation during the iterative process of feature selection.
FEATURE EXTRACTION
The features which are very crucial for our model are as follows:
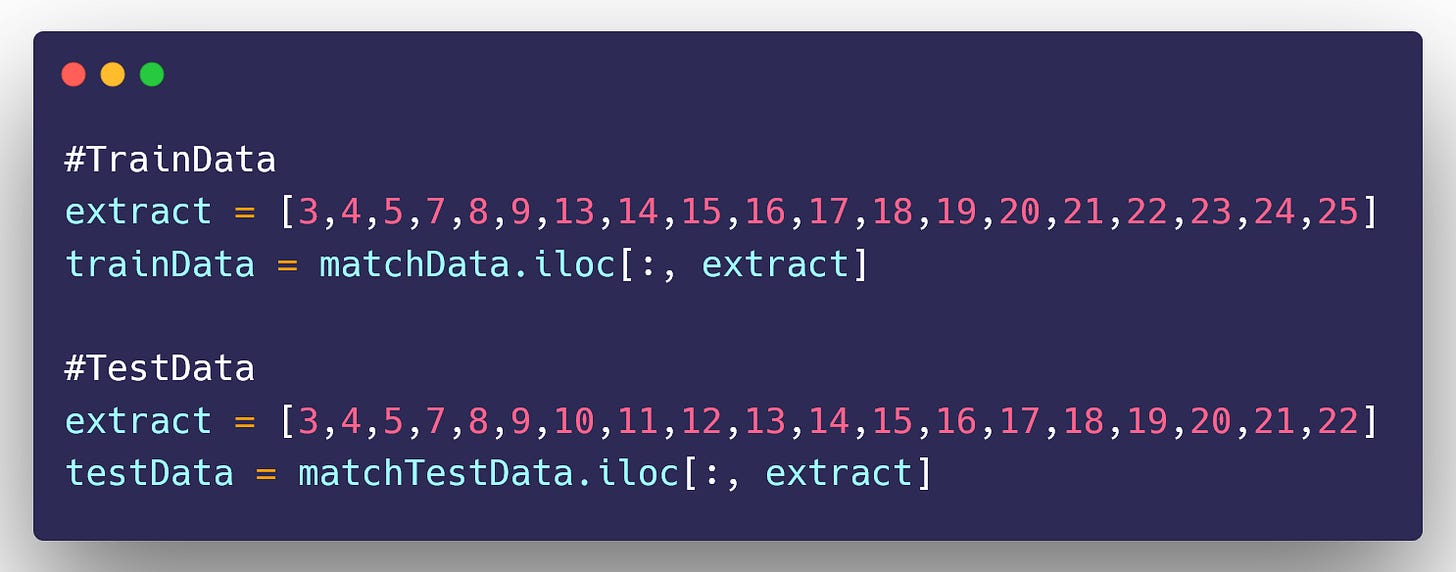
GF, GA, xG, xGA, Poss, shotCreatingAction, PassLive(LeadingtoShotAttempt), PassDead(LeadingtoShotAttempt), dribblesLeadingToShot, goalCreatingAction, PassLive(LeadingtoGoal), PassDead(LeadingtoGoal), dribblesLeadingToGoals, Total_Shots, Shots_on_target, Shots_on_target%, Goals/Shot, Goals/ShotsonTarget, Result
Let’s extract these features from our dataset:
Now, Let’s look at the class distribution of the wins(W), loss(L) and draws(D) in our train data and test data.
TARGET VARIABLE DISTRIBUTION
Train Data Distribution
Test Data Distribution
Dropping the Result Column for now
NORMALIZATION
Normalization can help in training our neural networks as the different features are on a similar scale, which helps to stabilize the gradient descent step, allowing us to use larger learning rates or help models converge faster for a given learning rate.
We will Normalize all our features now in the range of 0 and 1.
LABEL ENCODING
Encoding our output class in very important because we can’t input output labels to the model and ask it to predict.
We are performing Multiclass Classification using Neural Networks.
In our output class, we have 3 output labels (i.e) Wins(W), Loss(L) and Draws(D). We will use a label encoder to encode this class into numeric values.
Adding the Result column back to our data:
Creating a new column ‘Result_cat’ and encoding our Output class which is ‘Result’
Dropping the Result column, now we wouldn’t need it for our model.
Create Input data and Output data
This features length variable is being created, and we’ll need it later when generating the PyTorch model. We could also do it later.
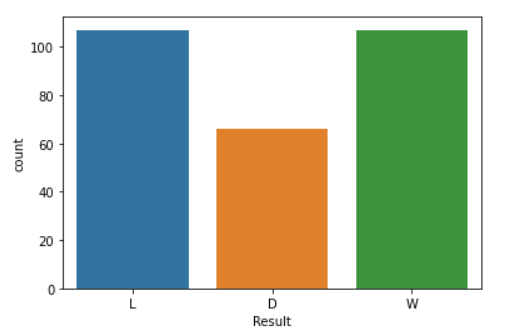
Visualize Class Distribution in Train Data and Test Data.
We can notice that our data is perfectly balanced in terms of Wins and Losses. Although, you can notice that the Draw count is equally less in both datasets which is fair considering the amount of matches teams play and results are taken into consideration.
NEURAL NETWORK
In this project, we will be using PyTorch to build a multi-class classification model to predict the outcomes of La Liga matches. Multi-class classification is a supervised learning problem where the goal is to classify instances into one of the multiple classes. In the context of this project, we will use the historical match data to train a model that can predict the outcome of a match as a win for the home team, a win for the away team, or a draw. PyTorch offers a variety of pre-built neural network architectures that can be easily adapted to perform multi-class classification. Additionally, PyTorch also provides a wide range of tools and functionalities that can be used to fine-tune and optimize the model, such as loss functions, optimizers, and regularization techniques. By using PyTorch to build our multi-class classification model, we will be able to leverage the power of neural networks to make accurate predictions about the outcomes of La Liga matches.
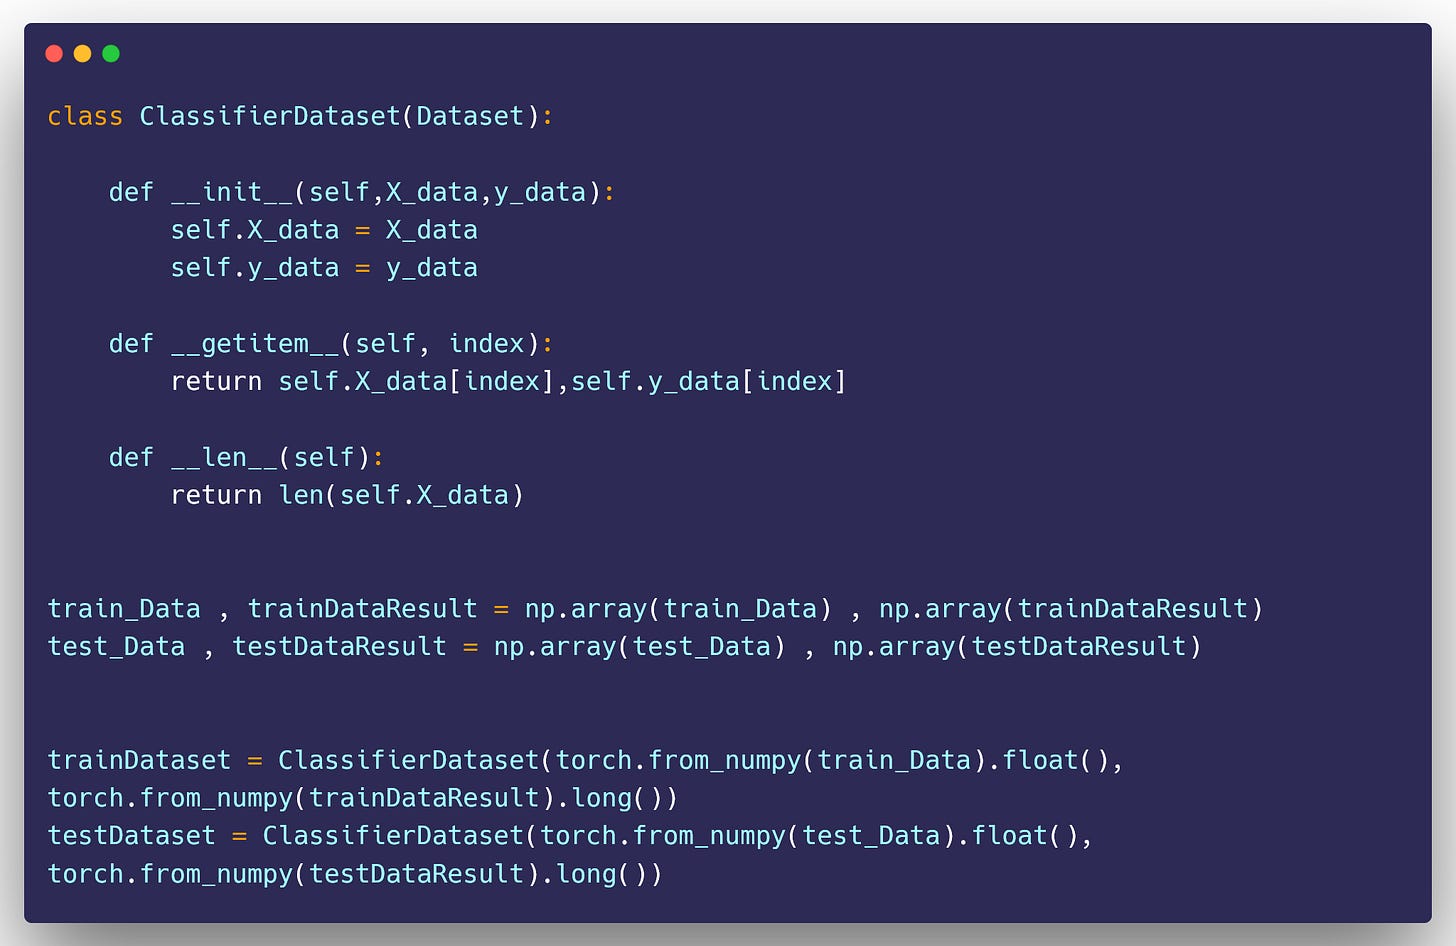
CUSTOM DATASET
We will be using a custom dataset to pass the values into our model. make sure that the input is float while the output is long.
MODEL PARAMETERS
Let’s define the model parameters we will use in our model.
DATA LOADERS
Data loaders are employed in PyTorch to load and prepare data for usage in a neural network model. They are frequently combined with PyTorch’s DataLoader class, which offers a simple method for iterating over the data in a dataset.
We will be initializing our Train loader and Test loader. For the train, the loader will be keeping the batch size of 32 and for the test, the loader will be keeping our batch size of 16. However, feel free to initialize whichever value you find useful.
CLASS COUNTS & CLASS WEIGHTS
The number of examples in each class of a dataset is referred to as class count. A model may find it challenging to correctly categorize instances of the under-represented classes in a dataset when some classes are highly over-represented.
Each class in the dataset is given a weight using class weights, where the weight is inversely proportional to the class count.
Under-represented classes are given greater weights, which encourages the model to concentrate more on correctly categorizing examples of these classes. This may aid in balancing the class distribution and enhancing model performance as a whole.
NEURAL NET ARCHITECTURE
We are building a simple 3-layer Feed-Forward Network with Dropout and Batch normalization.
To train our multi-class classification model, we will first initialize the model, optimizer, and loss function in PyTorch. Our model will be a neural network architecture, which we have defined previously. The optimizer of choice is Adam, which is a popular optimization algorithm. And, as this is a multi-class classification problem, we will use the CrossEntropyLoss function as the loss function to measure the performance of the model during training. This loss function is a suitable choice for this type of problem as it can handle multiple classes and account for class imbalance if any.
TRAINING THE MODEL
Function to calculate model accuracy
Dictionary variables to store Accuracy and Loss Stats
MODEL TRAINING
VISUALIZING
Visualize Accuracy and Loss in our Trained Model
Now, Let’s Test our Model on our Test Dataset
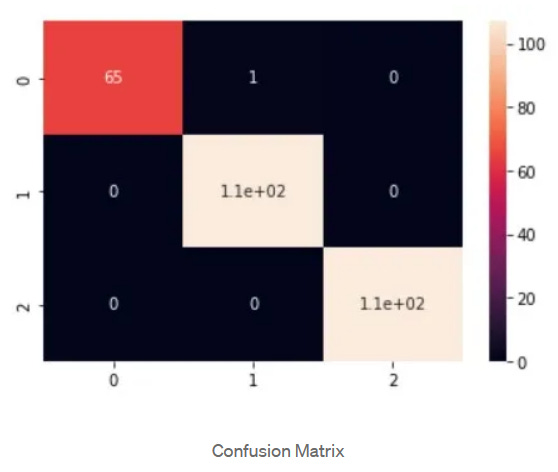
Confusion Matrix and Classification Report for viewing how model performed on the Test Data.
CONFUSION MATRIX
CLASSIFICATION REPORT
You can find all the files related to this project in my Github Repository. Feel free to drop a star if you like it. You can follow me there for more such Data Science Projects.
I have also built a Streamlit Dashboard for Data Visualization of this project. My next Article will be based on How to use Streamlit to build a Soccer Analytics Dashboard.
I appreciate you taking the time to read this article. Thank you :)


